 Beyond the Dashboard: What Your Monthly Executive Overview Is Really Telling You
In the modern corporate landscape, executives are rarely starved for data. Most leadership teams are inundated with dashboards, spreadsheets, and KPIs — yet a persistent problem remains: an abundance of metrics with very little diagnostic clarity. A stable “total score” often acts as a veil, masking localised failures or emerging systemic threats that could compromise operational resilience.
Is your organisation’s high average a sign of true health, or is it a smooth surface hiding the very gaps that will define next quarter’s compliance posture?
The Philosophy: Why This Report Exists
The Monthly Executive Overview Report is designed to answer a fundamental question for senior leadership:
What is the current health of our organisational quality, and where must we intervene to drive performance and mitigate risk?
While granular data captures individual moments, organisational success is driven by high-level trends and strategic alignment. This report synthesises complex performance data into a cohesive narrative to reveal:
- Organisational Momentum: Whether quality and compliance standards are trending toward excellence or signalling a decline.
- Operational Scale & Scope: A snapshot of the total workload and the human capital driving the organisation.
- Systemic Strengths & Risks: Identification of institutionalised best practices versus recurring gaps in compliance and customer empathy.
- Comparative Team Health: A clear view of how different units perform against one another, highlighting where performance is consistent and where it is fragmented.
- Strategic Action Pathways: Prioritised recommendations that translate performance gaps into structured coaching plans and process improvements.
Without this executive-level view, decision-makers risk being buried in data without direction. This report ensures leadership moves beyond mere observation — providing the clarity needed to turn high-level insights into informed, decisive action. To see this philosophy in practice, let’s look at the March 2026 organisational performance.
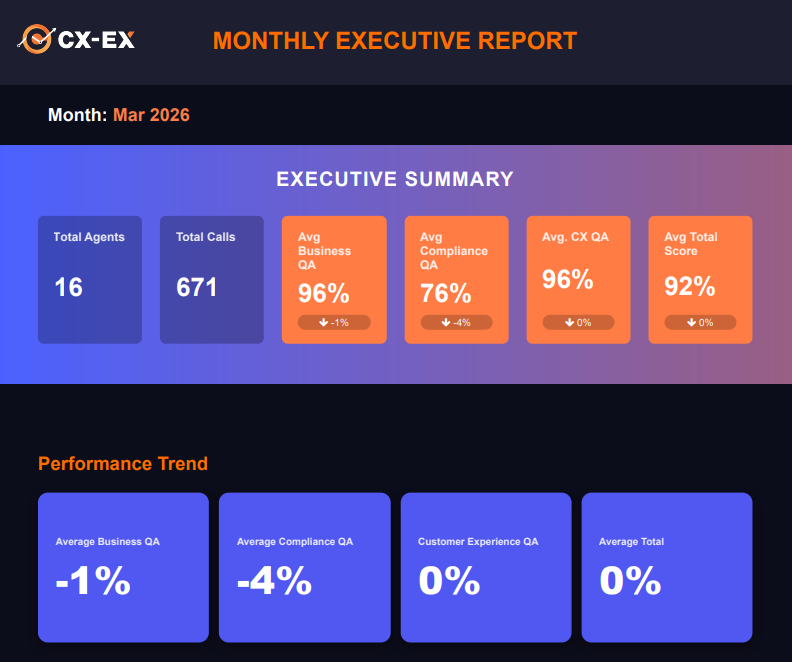
1. The Illusion of High Performance: The CX vs. Compliance Gap
A high-level glance at the March 2026 data might suggest an organisation in peak health, with Customer Experience (CX) QA sitting at a robust 96%. However, a closer look reveals a dangerous divergence: Compliance QA has plummeted to 76%, reflecting a significant
4% decline in a single month.
This creates a counter-intuitive performance profile. Front-line teams appear professional, polite, and helpful (High CX), yet they are simultaneously exposing the business to substantial regulatory risk through inconsistent caller verification. This gap is the primary driver of the current compliance erosion.
“The consistency in high Business QA and CX QA scores indicates strong professionalism and customer rapport, but the dip in compliance highlights systemic gaps that could expose the business to operational risks.”
When your staff is winning over customers but failing the fundamentals of risk mitigation, you aren’t just providing good service — you are visualising a mounting legal liability.
2. The Ranking Paradox: Why Volume Tells a Shallower Story
Operational volume is often used as a proxy for performance, but the diagnostic report suggests that ranking and relative improvement are far more indicative of management health. Consider the comparison between Team A and Team B, both of which handled nearly identical volumes in March (334 and 337 calls, respectively).
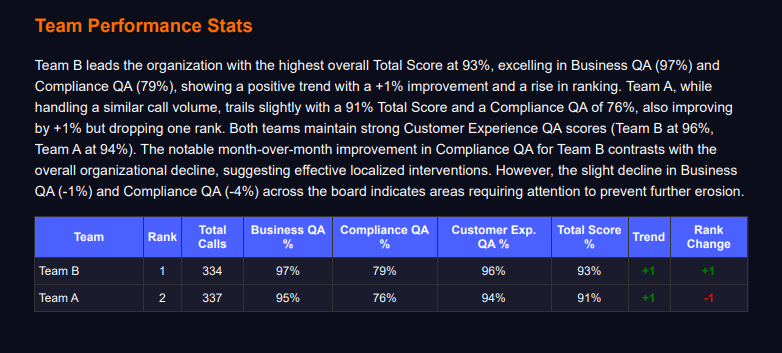
The nuance lies in their trajectory. Team B improved its ranking (+1) to lead the organisation with a 93% total score, specifically bucking the downward organisational trend with a 79% score in Compliance. Team A, by contrast, dropped a rank despite actually improving their total score by +1.
“In a high-performing environment, absolute improvement is not enough if you are being outpaced by the organisational standard. Stagnation is a form of regression when measured against localised interventions driving competitor success.”
Team A’s drop in rank is a warning shot: when the organisational floor rises, standing still means falling behind — regardless of what the absolute number says.
3. The “Soft Skills” That Drive Hard Metrics
The report identifies that top-performing agents do more than just hit their numbers; they possess specific traits that influence the entire team culture. These agents serve as role models for professionalism and provide benchmarks for peer development.
Key characteristics of these high-achievers include exemplary empathy and rapport-building — turning transactional calls into positive human interactions, especially during high-stress scenarios. They demonstrate jargon-free communication, simplifying complex insurance or policy terms to ensure customer clarity. And they exhibit efficient call flow management, balancing thoroughness with speed to ensure effective resolution — a sharp contrast to lower-performing agents who struggle with inconsistent summarisation and call closure.
“Professionalism ensures a pleasant call, but technical accuracy and empathy under pressure are what convert routine interactions into retained customers. Niceness scales easily; nuanced human judgement does not.”
This distinction reframes how leaders should think about talent. The top performers aren’t just hitting metrics — they’re encoding institutional knowledge that, if captured and scaled, becomes the organisation’s most durable competitive moat.
4. Identifying the Friction Points in Operational Workflows
The March report highlights a clear divide between routine, revenue-stable tasks and high-complexity interactions. The organisation excels in administrative routines — Claim Status Updates and Lodging New Claims, Policy Renewal Requests, and Billing & Payments all perform strongly.
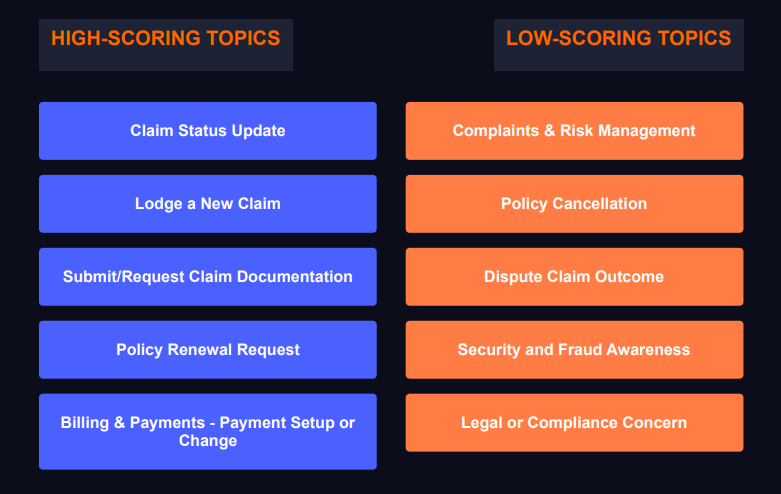
However, performance falters significantly in the categories that actually shape risk exposure: Complaints & Risk Management, Security and Fraud Awareness, and Legal or Compliance Concerns. This analysis reveals that while the organisation is proficient at administrative routines, it lacks the rigour required for high-risk interactions. The single most urgent coaching focus required to stabilise the operation is
Caller Verification — a foundational compliance behaviour that, when inconsistent, undermines every downstream control.
The pattern is clear: the organisation has mastered the predictable and stumbled on the consequential. Resolution requires coaching at scale through systemic interventions — role-play exercises simulating verification and dispute scenarios — and strategic paired monitoring sessions where compliance coaches provide immediate feedback on high-risk protocols.
5. From Manual Review to AI-Synthesised Intelligence
Traditional Quality Assurance relies on manual sampling — reviewing a tiny percentage of calls and hoping it represents the whole. The AutoInsights and AI Reports (CXEX) framework replaces manual QA effort with decision-ready insights. By using AI to analyse thousands of interactions, leaders gain access to specialised intelligence:
- Digitalisation Discovery: Automatically identifying high-volume, repeatable interactions primed for automation.
- Issue Resolution Deep-Dive: Analysing resolution outcomes at scale to identify the root causes of repeat issues.
- Structural Trends: Moving from raw numbers to a cohesive story of organisational health and risk exposure.
This shift transforms leadership posture — from chasing isolated failures to engineering systemic improvements grounded in the full population of interactions, not a sampled fraction of it.
Snapshot: March 2026 Executive Overview at a Glance
| Metric |
Score |
Signal |
| Average Total Score |
92% |
Baseline, not a finish line |
| CX QA |
96% |
Strong rapport, masks risk gap |
| Compliance QA |
76% (↓ 4%) |
Erosion in regulatory rigour |
| Leading Team (Team B) |
93% (Rank +1) |
Bucking the downward trend |
| Falling Team (Team A) |
+1% score, Rank -1 |
Improving, but outpaced |
| Primary Coaching Focus |
High Priority |
Caller verification, disputes, fraud |
Conclusion: From Data to Action
The March 2026 report shows a stable total average score of 92%. In many organisations, this would be cause for celebration. As a diagnostic tool, however, this report tells us that 92% is a baseline, not a finish line.
The primary directive for leadership is clear: prioritise closing the 4% compliance gap through mandatory training on caller verification, and scale the best practices of top-performing agents through structured peer mentoring. The focus must shift from general professionalism to specific regulatory rigour to ensure long-term operational resilience.
As you review your own organisation’s metrics this month, look past the headlines and ask: If your customer rapport is at an all-time high, but your compliance is slipping, are you building a loyal customer base — or a mounting legal liability?