Beyond the Monthly Summary: What Your Team Performance Reports Are Really Revealing
For many operations leaders, a 92% team average score feels like a victory lap. The dashboard glows green, the executive summary reads well, and the temptation to declare success is strong. But that headline number often hides a more complicated story — one of internal variance, ranking shifts, and silent compliance risks waiting to surface.
Is your team’s high average a sign of true excellence, or is it a veil smoothing over the very gaps that will define next quarter’s performance?
The Philosophy: Why This Report Exists
The Monthly Teams Report is designed to answer a critical leadership question: How is each team performing collectively — and where should Team Leaders focus to improve consistency, quality, and risk management?
While individual agent reports are excellent for identifying specific behavioural gaps, true performance management happens at the team level. This report aggregates performance to reveal the “big picture” metrics that individual views often miss:
- Team-Wide Quality Trends: Measuring consistency across all agents rather than isolated performers.
- Compliance Risk Exposure: Surfacing high-priority coaching needs before they become regulatory issues.
- Performance Momentum: Distinguishing between stable averages and dangerous internal variance.
- Strategic Prioritisation: Moving leaders from “reactive coaching” to “coaching at scale.”
By identifying whether a dip in scores is an individual outlier or a systemic team gap, this report empowers leaders to act with precision. To see this philosophy in action, let’s look at the January 2026 performance for Team A.
1. The Compliance Comeback: Momentum as a Metric
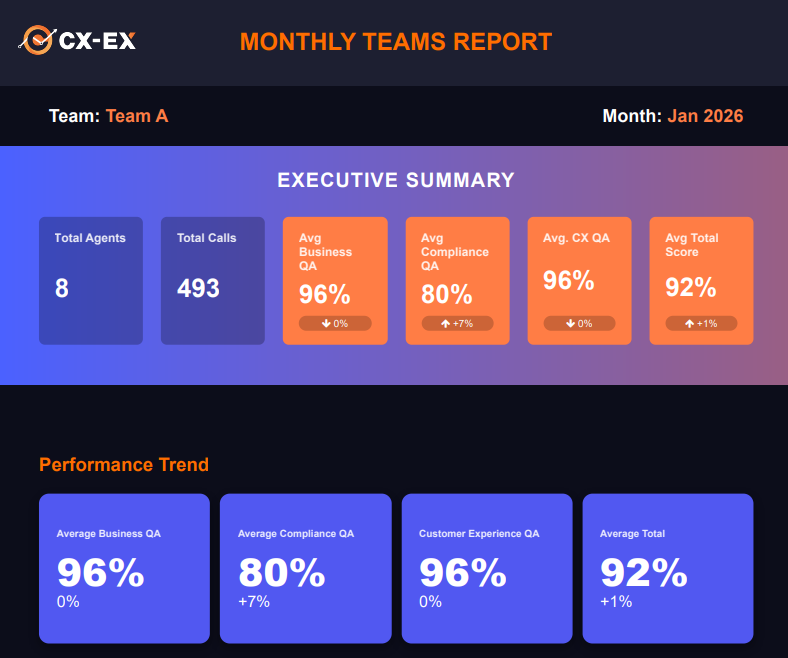
At first glance, Team A’s January 2026 report suggests an operation firing on all cylinders — a 92% average total score, a modest 1% increase from the previous month. It is easy for leadership to remain complacent.
However, high-level metrics can be deceptive. The most significant takeaway from the January report isn’t the final score, but the movement within the Compliance QA metric. The team’s compliance score rose from 73% to 80% — a +7% jump.
While 80% is still lower than other averages, this momentum is the ultimate indicator of a healthy CX environment. It suggests that “Consistency Opportunities” identified in previous cycles are being narrowed. As noted in the report’s analysis:
“Tactical shifts are taking hold. In a strategic context, the rate of improvement in high-risk areas is often a better predictor of future success than a static high score in a low-risk category.”
2. The Ranking Paradox: Why Standing Still Is Falling Behind
The January data reveals a “ranking paradox” that serves as a warning for talent management. In a high-performing environment, absolute scores are secondary to relative growth.
Consider two contrasting cases. Ricky Ponting maintained a solid total score of 94% — a figure that typically signals top-tier performance. Yet he suffered the team’s largest negative ranking shift, dropping 6 places. Meanwhile, Yuvraj Singh achieved the top score of 97% and saw the largest positive ranking change of +3.
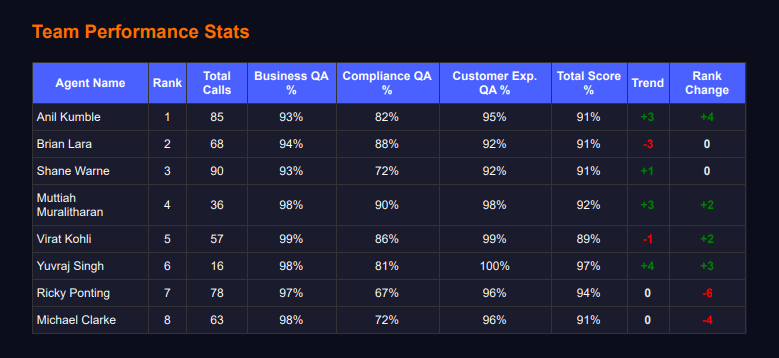
When systemic team gaps are closed and the floor rises, an agent who merely maintains a “good” score effectively falls behind. Trend Rank Change is a vital driver — it measures an agent’s adaptability relative to the rising team standard.
3. The “Soft Skill” Ceiling: Lagging vs. Leading Indicators
Team A’s top strengths are centred on “Consistency” — professionalism, polite greetings, and jargon-free communication. From a strategic perspective, these are lagging indicators. They represent the baseline results of foundational training.
The real risk is found in leading indicators such as handling complex billing, claims, and caller verification. While the team excels at being “nice,” they struggle with technical complexities.
“Professionalism ensures a pleasant call, but technical accuracy prevents churn and reduces escalations. Niceness is a commodity; navigating complexity is the high-value differentiator.”
This distinction reframes how leaders should allocate coaching time. Polishing what’s already strong yields diminishing returns. Investing in complex-scenario mastery is where competitive advantage is built.
4. From Individual Errors to Systemic Oversight
The January report marks a shift from reactive coaching to strategic oversight. Traditionally, leaders chase individual errors in a “whack-a-mole” approach — addressing each failure as it surfaces, with no view of the underlying pattern.
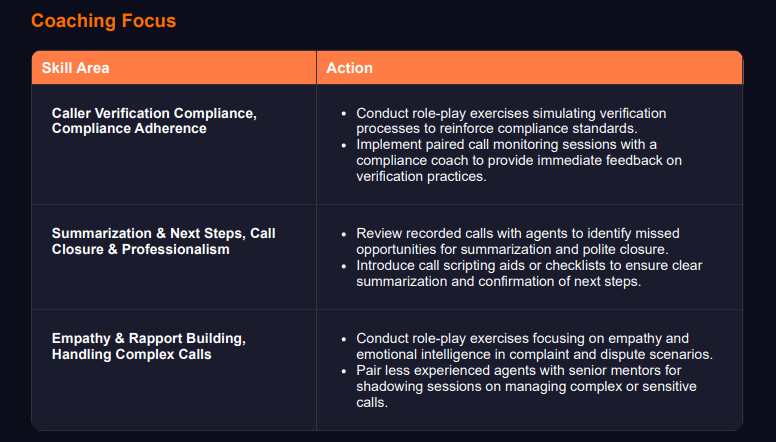
By analysing the aggregate data, leaders can distinguish between individual underperformance and systemic team gaps. For example, caller verification failures were identified as a team-wide inconsistency in January. This isn’t an Adam problem or a Yuvraj problem — it’s a Team A problem. The resolution requires “coaching at scale” through:
- Systemic Interventions: Role-play exercises specifically simulating verification and dispute scenarios.
- Strategic Paired Monitoring: Sessions with compliance coaches providing immediate feedback on high-risk protocols.
5. The Silent Risks: What 96% Really Means
Perhaps the most critical lesson is found in the “Low-Scoring Topics.” On paper, the team boasts a nearly perfect Business QA average of 96%. However, this perfection masks significant risk exposure in critical areas: Dispute Claim Outcomes, Policy Cancellations and Refunds, and Technical Support.
These topics represent the moments of greatest friction — the interactions that genuinely test brand resilience. A team can look exceptional on an executive summary while still struggling with the very conversations that lead to churn, complaints, and reputational damage. When disputes are handled poorly, the risk to the business remains high, regardless of how polite the initial greeting was.
Snapshot: Team A’s January Performance at a Glance
| Metric | Score | Signal |
|---|---|---|
| Average Total Score | 92% (↑ 1%) | Stable surface, hidden variance |
| Compliance QA | 73% → 80% | Strong upward momentum |
| Business QA | 96% | Masks high-risk topic gaps |
| Top Performer (Yuvraj Singh) | 97% (Rank +3) | Adaptive, rising with the team |
| Falling Performer (Ricky Ponting) | 94% (Rank -6) | Standing still as floor rises |
| High-Risk Topics | Low | Disputes, cancellations, tech support |
Conclusion: Beyond the Monthly Summary
The January 2026 report for Team A is not just a grade — it is a strategic roadmap. It highlights an urgent need to bridge the gap between “politeness” and “precision,” and it equips leaders to coach against patterns rather than incidents.
By focusing on compliance momentum, relative ranking shifts, and high-risk topics, leadership can move from mere oversight to genuine strategic optimisation. As you review your own team’s metrics this month, look past the headlines and ask: Is your team’s high average score a sign of excellence, or a mask for your greatest compliance risk?
The answer isn’t in the 92%. It’s in the 4% you’re not looking at.